Streaming IoT Data into the Lakehouse: Kafka + Delta Live Tables
Step-by-step guide for ingesting high-velocity IoT or sensor data into Databricks Delta Lake with real-time processing and storage optimizations.
REAL-TIME ANALYTICS & EVENT-DRIVEN ARCHITECTURE
Kiran Yenugudhati
1/18/20252 min read
This blog explains how to design a real-time ingestion pipeline for IoT and sensor data using Apache Kafka as the ingestion layer and Databricks Delta Live Tables (DLT) for transformation and storage in a Lakehouse format.
You’ll learn how to:
Ingest IoT telemetry using Kafka
Process and clean streaming data with Delta Live Tables
Handle late-arriving or out-of-order events
Store curated data in bronze/silver/gold tables for real-time analytics
🔍 Why This Matters
IoT data — like temperature, vibration, energy usage, occupancy, or equipment status — is:
High-volume
Time-sensitive
Noisy and often incomplete
Batch ingestion fails to keep up, and traditional warehousing can be too rigid. A Lakehouse powered by Kafka + Delta Live Tables offers:
Real-time processing
Schema evolution
Low-latency access to curated datasets
Unified storage and analytics in one platform
🧰 Tech Stack
Ingestion : Apache Kafka => Stream telemetry from devices
Processing : Databricks Delta Live Tables => Stream transformation, quality checks
Storage : Delta Lake (Bronze/Silver/Gold) => Unified, queryable data lakehouse
Dashboards : Power BI / Tableau => Visualize real-time trends
Monitoring : Databricks SQL / ML => Anomaly detection, health scoring
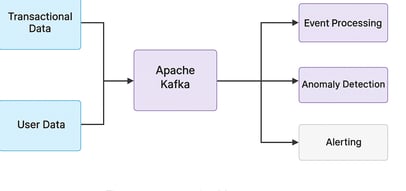
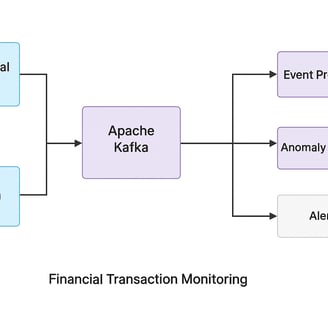
🛠️ Architecture Flow
🧪 Step-by-Step Pipeline
1. Stream IoT Events into Kafka
Set up producers (e.g., gateway, edge agents) to send JSON-encoded messages to a Kafka topic like iot_device_stream.
Example payload:
{ "device_id": "sensor-321", "timestamp": "2025-04-01T12:35:00Z", "temperature": 74.6, "humidity": 41.2, "battery": 97.5, "status": "active" }
2. Read from Kafka into Delta Live Tables
Use DLT in streaming mode to ingest from Kafka:
Use Auto Loader or Kafka connector in Databricks
Persist into a bronze table (raw log layer)
🛠️ Notebook snippets and schema definition coming soon
3. Transform and Clean the Data (Silver Layer)
Apply schema, convert timestamps, filter out invalid readings:
🛠️ Code snippets coming soon
4. Curate Gold Tables for Analytics
Aggregate for dashboards or ML models:
🛠️ Code snippets coming soon
📊 Example Use Cases
Real-time monitoring of HVAC systems or energy meters
Alerting for abnormal sensor readings (e.g. spikes in vibration or heat)
Time series modeling for predictive maintenance
Facility or room usage optimization
🔐 Data Quality & Governance
Schema evolution supported via DLT
Each layer (bronze, silver, gold) is traceable and audit-ready
You can attach expectations (data quality rules) in DLT
🎯 Key Benefits
✅ Real-time, end-to-end IoT data flow
✅ Declarative transformations with managed orchestration
✅ Scale to millions of events/day
✅ Unified Lakehouse storage with Delta
✅ Easy integration with BI, ML, and alerting tools
📌 Conclusion
With Kafka + Delta Live Tables, you can build scalable, real-time pipelines that turn raw IoT data into actionable insights — from predictive maintenance to occupancy monitoring.
No more overnight batches. No more CSV drops. This is modern, streaming analytics for the physical world.
📎 Artefacts
GitHub notebook templates
Auto Loader + Kafka config examples
Sample dashboards in Power BI / Tableau
ML model for anomaly detection on sensor trends
ACTUVATE PTY LTD
Delivering strategic data architecture, cloud engineering, and AI-driven solutions
Connect
Insights
contact@actuvate.com.au
© 2024. All rights reserved.